

The staffing agency KPIs that show where margin is made include gross profit by desk, gross margin for contract and direct-hire placements, spread per hour, fill rate, and days to fill. Revenue alone does not tell the full story. A desk can generate more revenue while earning less profit on each contract. Publicly listed staffing firms report financial results every quarter, giving agency owners a way to compare their own performance with real-world examples.
Key takeaways
- Record gross profit in dollars and gross margin as a percentage of revenue, with contract staffing and direct hire reported separately.
- Measure your contract staffing margin against contract staffing margins, and compare your total gross margin with other companies' total figures.
- When a client limits your markup, as the Massachusetts contract does, calculate your employment costs before agreeing to a rate and monitor gross profit per hour.
- Calculate the percentage of eligible requested positions filled, using the same definition across every desk.
- Calculate monthly gross profit per recruiter and compare each recruiter with their own performance last quarter.
This guide is for staffing agency owners running teams of recruiters who track revenue by branch but need to understand which desks actually make money. It explains the key metrics behind a staffing firm's profit and loss (P&L) statement, how to calculate each one, what publicly listed staffing companies report, and how to build a monthly performance report using your own data. Time to fill gets its own section because clients track this metric too.
Two cautions matter when using these benchmarks. First, each figure represents one company's reported results for one quarter, so every comparison is tied to a specific company and period. No public primary source provides these figures specifically for staffing agencies of this size, making them reference points rather than targets. Second, we found no public source establishing industry-wide benchmarks for submittal-to-interview-to-placement ratios. This guide therefore explains how to calculate those ratios so you can measure your own team's performance.
In this article
- Why does revenue hide where a staffing firm makes money?
- What is a good gross margin for a staffing firm?
- Why does gross profit per placement matter more than revenue?
- What is the spread, and how do bill rate, pay rate and markup fit together?
- Why is operating margin so thin even when gross margin looks healthy?
- How do you calculate fill rate, and what should count?
- What does days to fill tell a staffing owner?
- How do you measure revenue and gross profit per recruiter?
- What does the staffing market look like in 2026?
- Which mistakes make these numbers lie?
- How do you build the monthly desk report?
- Conclusion
- Frequently asked questions
Why does revenue hide where a staffing firm makes money?
Revenue in a staffing firm includes money that goes straight back out to pay workers. For contract placements, the agency bills the client an hourly rate and pays the worker a lower rate, along with payroll taxes and insurance costs. The difference between what the client pays and the costs of employing the worker determines how much the agency earns. A desk handling large volumes of low-margin contracts can generate the highest revenue in the firm while contributing less profit than a smaller desk with better rates or more permanent placements.
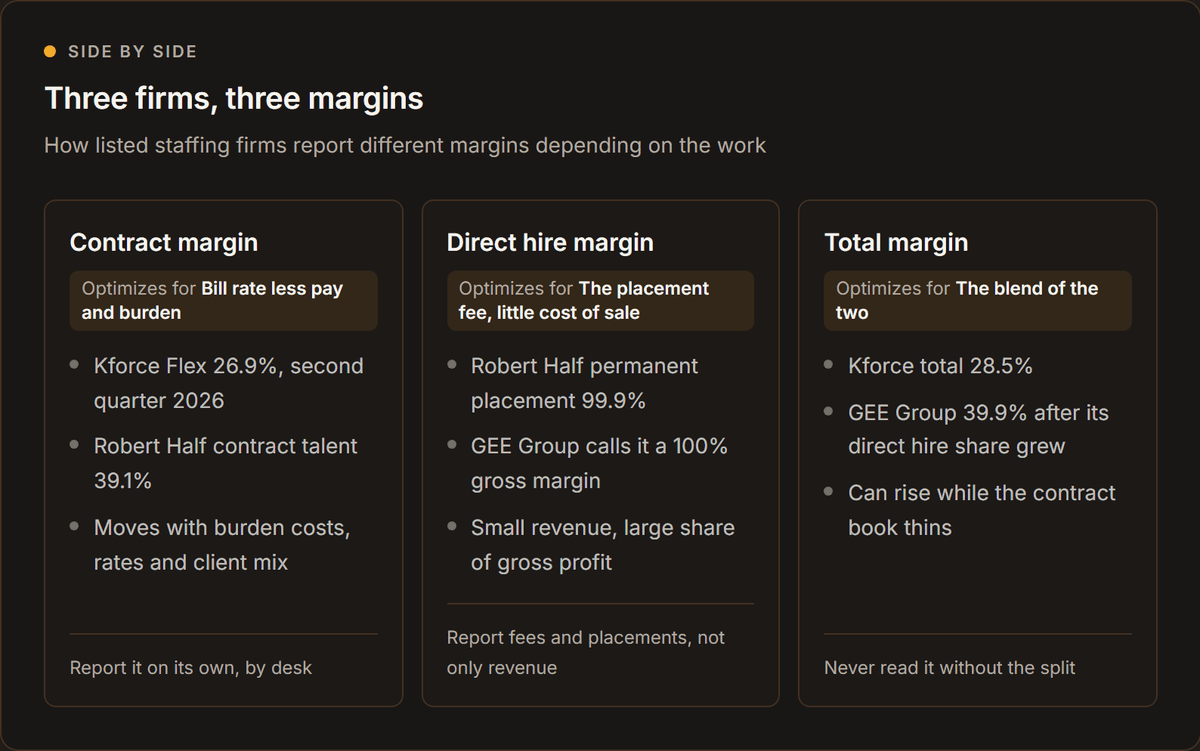
Robert Half's second-quarter 2026 results illustrate the difference. In its revenue table, in thousands of dollars, contract talent revenue was 747,405 against 117,991 from permanent placement.1 Looking at revenue alone, permanent placement appears to be a much smaller part of the business. Gross margin tells a different story. Robert Half reported a gross margin of 39.1% for contract talent and 99.9% for permanent placement in the same quarter.1 In other words, a dollar of permanent placement revenue contributed considerably more gross profit than a dollar of contract staffing revenue.
GEE Group, a US staffing firm, demonstrates the same principle. The company reports that direct-hire placement revenue carries a 100% gross margin, meaning it has no associated direct costs of revenue.2 A higher proportion of direct-hire placements can therefore lift the firm's overall gross margin. In the quarter ended 30 June 2026, GEE Group's gross margin increased to 39.9%, up from 35.4% a year earlier.2 Contract staffing revenue fell 20% to $17 million, while direct-hire revenue rose approximately 16% to $3.8 million.2 The company also attributed about half of its contract revenue decline to losing one high-volume, lower-margin account.
The lesson for staffing agency owners is that falling revenue does not necessarily mean falling profitability. GEE Group generated less contract revenue but achieved a higher overall gross margin as its business mix changed. Losing a large, low-margin account while increasing direct-hire placements made the business smaller in revenue terms but more profitable per dollar of revenue. An agency owner looking only at revenue by branch could easily have interpreted the quarter as a failure.
The first improvement to make is straightforward: report gross profit in dollars and gross margin as a percentage for every desk each month, with contract staffing and direct hire shown separately. These figures reveal where the agency actually makes money and provide the foundation for the other KPIs in this guide.
What is a good gross margin for a staffing firm?
There is no single gross margin that every staffing firm should aim for. The right figure depends on the type of roles you fill, the balance between contract staffing and direct hire, the clients you serve, and the programmes you run. Publicly listed staffing firms report margins across a wide range, making their results useful reference points rather than universal targets.
| Company | Business | Gross margin reported | Period |
|---|---|---|---|
| Robert Half | Contract talent | 39.1% | Second quarter 2026 |
| Robert Half | Permanent placement | 99.9% | Second quarter 2026 |
| GEE Group | Total | 39.9% | Quarter to 30 June 2026 |
| ASGN | Commercial segment | 31.0% | First quarter 2026 |
| ASGN | Federal government segment | 19.6% | First quarter 2026 |
| AMN Healthcare | Consolidated | 30.6% | Second quarter 2026 |
| Kforce | Total | 28.5% | Second quarter 2026 |
| Kforce | Flex (contract) | 26.9% | Second quarter 2026 |
| TrueBlue | Total | 20.7% | Second quarter 2026 |
| The Adecco Group | Total | 18.6% | Second quarter 2026 |
Each figure represents that company's reported results for the specified period. The figures are not directly interchangeable because the companies have different business models and revenue mixes.
Kforce reported a total gross profit margin of 28.5% in the second quarter of 2026, up 140 basis points year over year.3 Its Flex division, which covers contract staffing, reported a lower margin of 26.9%. Direct-hire placement fees contribute to the company's total margin, lifting it above the contract-only figure.
ASGN's results show why it is important to separate different types of clients. In the first quarter of 2026, its commercial segment reported a gross margin of 31.0%, compared with 19.6% for its federal government segment and 27.5% overall.4 Even within one staffing firm, the type of client and work performed can produce substantially different margins.
TrueBlue's results demonstrate how employment costs can reduce profitability. Its gross margin fell from 23.6% in the second quarter of 2025 to 20.7% in the second quarter of 2026.5 Its own explanation attributed a 1.2-percentage-point reduction to workers' compensation costs and another 0.9 percentage points to business mix. Margins can therefore fall even when an agency has not changed its billing rates, because the costs of employing temporary workers have increased.
AMN Healthcare reported a consolidated gross margin of 30.6% in the second quarter of 2026.6 However, reserve releases and billing true-ups in its nurse and allied segment contributed to the result. These adjustments mean the reported margin should not automatically be treated as its normal, repeatable operating level.
ManpowerGroup's second-quarter 2026 results provide another way to examine the relationship between revenue and gross profit. Its results table shows revenues of 4,860.2 and gross profit of 780.3, both in USD millions.7
What should a staffing agency owner take from these comparisons?
First, compare like with like. Measure your contract staffing margin against contract staffing margins, and compare your total gross margin with other companies' total figures. Comparing a contract-only margin with a total margin that includes direct-hire fees can give you a misleading picture of your performance.
Second, break your own margins down by client type, as ASGN does with its commercial and federal government segments. Winning a large client programme at a low margin can gradually reduce your firm's overall profitability. Without reporting margins by client, you might not notice the problem until it has affected your results for several months.
Third, monitor employment costs as well as pricing. TrueBlue's results show that workers' compensation and changes in business mix can have a substantial effect on margins. A desk can maintain its billing rates and still become less profitable if the costs associated with its placements increase.
Finally, investigate the relationship between contract and direct-hire margins. If your total gross margin rises while your contract margin falls, a growing share of direct-hire fees may be masking declining profitability in your contract business. Direct-hire placements can contribute a high proportion of their fees to gross profit, but that does not mean the underlying contract business is becoming healthier.
The practical takeaway is to report three figures separately: contract gross margin, direct-hire gross margin, and total gross margin. Together, they show whether changes in your firm's overall profitability come from better performance, a different mix of work, or rising costs.
Why does gross profit per placement matter more than revenue?
Gross profit per placement shows how much each placement contributes towards paying for recruiters, office costs and the owner's profit. Revenue per placement tells you how much the client pays, but not how much the agency keeps after direct costs. For staffing agency owners, the distinction matters because a desk generating high revenue is not necessarily the desk generating the most profit.
Direct hire makes this difference particularly clear. Kforce reports its direct-hire business using revenue, placement numbers and average fee per placement. Korn Ferry reported 1,784 permanent placement engagements in the quarter ended 30 April 2026, for fee revenue of 59.8, in USD millions.8 Although these large firms have different client mixes from smaller agencies, their reporting illustrates the value of measuring placement volume alongside fee revenue. Dividing fee revenue by placements gives an average fee per placement, making it easier to assess the value of the work completed.
For contract staffing, gross profit per placement depends on the spread per hour, the number of hours worked and the length of the assignment. The spread is the difference between the hourly bill rate and the worker's pay rate, before accounting for additional employment costs. Two placements with identical bill rates can therefore generate very different amounts of gross profit if one assignment lasts a month and the other lasts a year.
Changes in business mix can also affect overall profitability. GEE Group's results illustrate this: its contract staffing revenue declined while direct-hire revenue increased, and its overall gross margin rose.2 For an owner deciding where to allocate recruiters, the important question is not simply which desk generates the most revenue. It is which desk produces the most gross profit relative to the resources it uses, and whether that profit comes from placement fees, hourly spreads or the volume and duration of assignments.
Track three measures for every desk each month:
- Placements: Record contract starts and direct-hire placements separately.
- Gross profit: Calculate the gross profit generated by each type of placement.
- Gross profit per placement: Divide gross profit by the number of placements, calculating contract and direct hire separately.
These figures help you identify which desks generate the greatest contribution from each placement and give you a stronger basis for deciding where to invest recruiting time and resources.
What is the spread, and how do bill rate, pay rate and markup fit together?
The spread is the difference between the hourly bill rate and the hourly pay rate: the amount between what the client pays and what the temporary worker earns. Markup expresses that difference as a percentage of the pay rate. Gross profit per hour is what remains after deducting the additional costs of employing the worker, known as the burden. These costs can include payroll taxes, workers' compensation and insurance.
A public-sector contract illustrates how these terms work in practice. The Massachusetts statewide temporary help contract defines markup as the fee charged above the hourly wage paid to the temporary worker and caps it at 36.5% of the worker's hourly pay rate.9 Its rate card sets a maximum bill rate of $41.40 per hour for an accountant, against a minimum pay rate of $29.35.9 The contract also sets conversion fees for temporary workers who become state employees: 15% of salary after 30 days, 10% after 60 days, 5% after 90 days, and no fee after that.9
Other contracts use different pricing structures. Tryfacta's staffing price list under Sourcewell, a cooperative purchasing programme, applies a 30% markup on pay rates for professional services and 33% for skilled trades and general labour.10 It also charges 12% of annual compensation when a temporary worker is hired directly onto a government agency's payroll.10 These are the rates specified by one supplier, not industry-wide benchmarks.
Two practical lessons follow for staffing agency owners.
First, a markup cap leaves little room for costs you have not accounted for. When a client limits your markup, as the Massachusetts contract does, calculate your employment costs before agreeing to a rate and monitor gross profit per hour. If workers' compensation or other employment costs rise, your gross margin falls unless you can adjust your pricing or reduce other costs. TrueBlue's reported results illustrate how changes in workers' compensation costs can affect margins.
Second, conversion fees affect the profitability of an assignment when a temporary worker becomes a permanent employee of the client. Under a sliding fee schedule like Massachusetts's, the amount earned depends on when the conversion happens. Know the terms of each client contract and report conversion fees separately so you can see how much they contribute to gross profit.
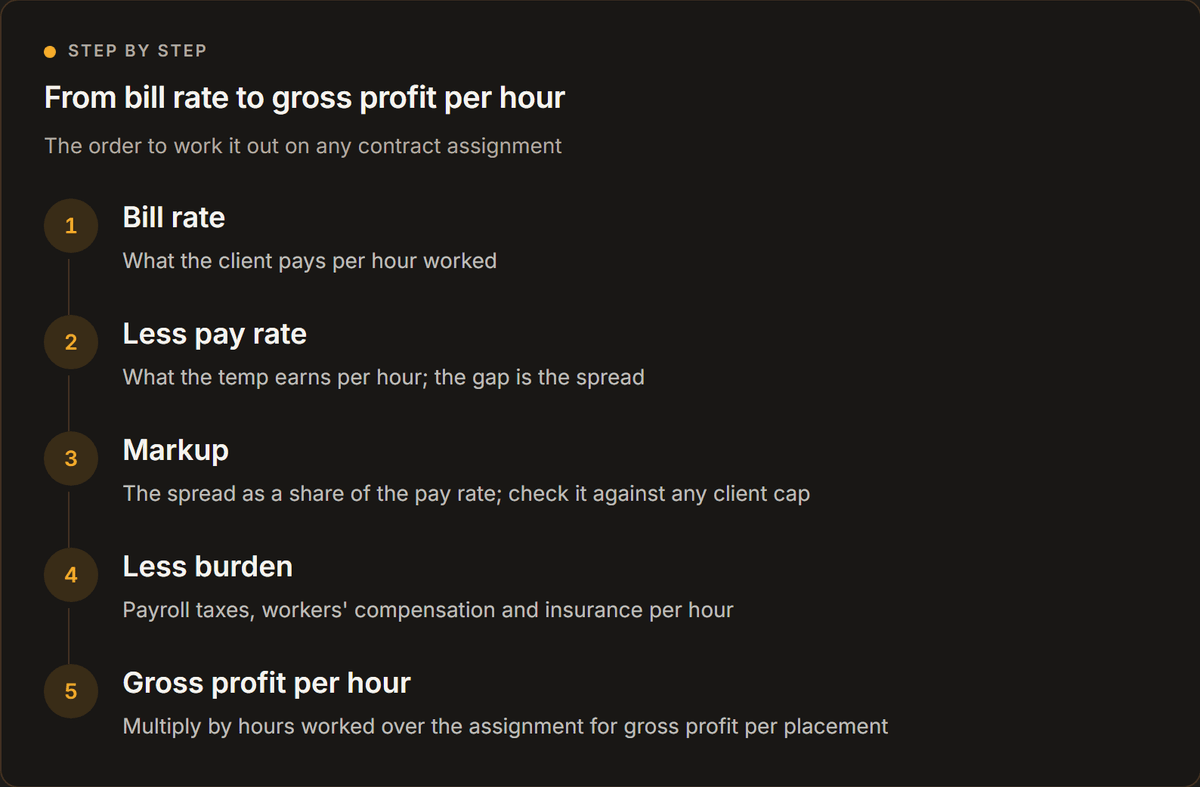
Gross profit is not the same as net profit, because it does not deduct overhead such as recruiter salaries, office costs or software.
Why is operating margin so thin even when gross margin looks healthy?
Most of a staffing firm's gross profit must cover the cost of running the business: recruiter salaries and commissions, sales staff, offices, software, management and other operating expenses. After paying those costs, the company may retain only a small percentage of its revenue as operating profit.
The results below show how thin operating margins can be across publicly listed staffing companies.
| Company | Measure | Reported | Period |
|---|---|---|---|
| Kforce | Operating margin | 5.4% | Second quarter 2026 |
| AMN Healthcare | Operating margin | 4.0% | Second quarter 2026 |
| TrueBlue, PeopleReady segment | Segment profit margin | 3.3% | Second quarter 2026 |
| Randstad | Underlying EBITA margin | 3.1% | Second quarter 2026 |
| The Adecco Group | EBITA margin excluding one-offs | 2.8% | Second quarter 2026 |
These figures use the companies' own reported measures, which are not perfectly interchangeable. Operating margin, segment profit margin and underlying EBITA margin can differ in the costs they include.
Kforce reported an operating margin of 5.4% in the second quarter of 2026, compared with a gross profit margin of 28.5%.3 Randstad reported an underlying EBITA margin of 3.1% on revenue of €5,897 million in the same quarter.11 The Adecco Group reported an EBITA margin excluding one-off items of 2.8%.12 TrueBlue's PeopleReady segment reported a segment profit margin of 3.3% on segment revenue of 262, in USD millions, while AMN Healthcare reported an operating margin of 4.0%.56
The difference between gross margin and operating margin represents the impact of operating expenses and any other items included in the relevant operating measure. For staffing firms, employee-related expenses are a major part of the cost base. That makes two measures particularly useful for agency owners.
The first is gross profit per recruiter. Does each recruiter generate enough gross profit to cover their own employment costs and contribute towards overhead? Revenue per recruiter can look impressive without answering that question.
The second is overhead as a share of gross profit. This shows how much of the money earned after direct placement or employment costs is consumed by the cost of running the agency.
When gross margin falls by one or two percentage points, the effect on operating profit can be substantial if operating margins are already thin. That is why owners should review contract and direct-hire margins, employment burden costs and operating expenses every month, rather than relying on revenue growth alone.
How do you calculate fill rate, and what should count?
Fill rate measures the proportion of requested positions that a staffing agency fills within a defined period. The calculation is straightforward: divide the number of filled positions by the number of eligible positions requested, then multiply by 100. The challenge is defining what counts as a position, when it qualifies as filled, and how to handle cancelled orders. Without consistent rules, monthly figures cannot be compared reliably.
Recruiterflow, a recruiting software provider, defines fill rate as the percentage of job orders, requisitions, openings or shifts that a recruiting or staffing team fills during a specified period.13 Its guidance also highlights the need to document the unit being measured, the reporting period, the completion criteria and the treatment of cancelled or paused work.13 Although this is a software vendor's definition, the underlying principle is important: two desks can report very different fill rates simply because they count different things. One might count each job order as a single unit, while another counts every position within those orders.
Client contracts can specify their own requirements. The Massachusetts statewide temporary help contract measures request fill rate using candidates submitted against candidates required.9 It expects three CVs per requested position and sets a minimum of 95%. However, this measures the agency's response to a request, not how many positions are ultimately filled. A client may receive the required number of candidates while still having vacancies to fill.
The American Staffing Association's Staffing Operations Benchmarking Survey offers another useful reference. It tracks average time to fill and order fill rate for temporary staffing, alongside measures such as submittals, interviews, send-outs and fallout placements for direct hire.14 The survey covers more than 120 benchmarks across temporary and contract staffing and direct hire.14 Its range of measures offers a useful starting point for designing your own performance report.
For consistent reporting, establish a definition and apply it every month.
- Unit: Count individual positions rather than job orders. An order for ten temporary workers represents ten requested positions.
- Period: Assign each request to the calendar month in which the order was opened. Use the same rule when reporting completed placements.
- Filled: For contract staffing, count a position when the worker starts. For direct hire, count it when the candidate accepts the offer. Keep these completion rules separate because an accepted offer does not guarantee that the candidate will start.
- Cancelled orders: Exclude a position from the eligible denominator only when the client cancels before the agency has had a reasonable opportunity to fill it. Record cancellations separately so they remain visible.
- By client: Report fill rate for each client as well as for each desk and the agency overall. A firm-wide average can hide clients whose vacancies your team consistently struggles to fill.
Calculate fill rate by dividing filled positions by eligible requested positions and multiplying by 100. Report the result by client and desk every month, using the same definitions throughout.
If you cannot confidently state your agency's current fill rate, establishing a consistent definition is the first step. Once the number is reliable, you can use it to identify where fulfilment is strong, where vacancies remain open, and which client relationships need attention.
What does days to fill tell a staffing owner?
Days to fill measures how long a staffing desk takes to turn a client's request into a worker's start date. It matters because clients often judge suppliers on speed, sometimes through targets written into their contracts. The longer a position remains vacant, the greater the chance that another supplier fills it first.
However, client contracts do not always measure the time it takes to fill a position. Some measure how quickly the agency submits candidates. The Massachusetts statewide temporary help contract, for example, requires resumes to be submitted within three days for at least 95% of requisitions, measured monthly.9 This is a speed-to-submittal target, not a measure of how long it takes for a worker to start.
Employers' own recruitment timelines provide another useful point of comparison. SHRM's 2026 benchmarking, based on data from more than 4,600 organisations, puts the median time to fill a nonexecutive position at 39 calendar days.15 This figure reflects employers' recruitment processes, including in-house hiring, rather than staffing agencies specifically. It is therefore not a direct staffing benchmark, but it indicates the length of the hiring process clients may be trying to shorten.
Staffing firms can report considerably shorter placement times. Bullhorn, a software provider serving the staffing industry, reported that its 2026 GRID survey of nearly 2,300 recruitment professionals found that 56% of the highest-growth firms reported average placement times of under ten days.16 These are self-reported survey results from a vendor's research, so they should be treated as an indication of performance among the surveyed firms, not a universal target for staffing agencies.
For your own monthly report, divide days to fill into two stages:
- Order received to first submittal:
Measures how quickly the desk identifies and presents suitable candidates. This helps you assess sourcing speed and the effectiveness of the initial job-order process.
- First submittal to start:
Measures the time between presenting the first candidate and the worker starting. This can reveal delays in client feedback, interviews, decisions, offers or candidate availability, as well as problems with how closely candidates match the brief.
The distinction matters because different delays need different fixes. If the first submittal takes too long, the desk may need to improve sourcing or clarify the role's requirements at intake. If candidates are submitted quickly but the start date takes much longer, the problem may lie in the client's decision-making process, candidate suitability or later stages of recruitment.
The job order intake call playbook covers the beginning of this process, while the guide to time to fill and time to hire explains how those two measures differ. Tracking both stages helps you identify where time is being lost rather than assuming every delay is a recruiting problem.
How do you measure revenue and gross profit per recruiter?
Calculate gross profit per recruiter each month by dividing the gross profit generated by a recruiter or desk by the number of recruiters responsible for producing it. Track revenue and placements alongside this figure, and compare each recruiter or desk with its own previous performance before comparing it with the firm-wide average. Gross profit per recruiter is a useful indicator of whether a desk generates enough money to cover its costs and contribute towards overhead.
Large staffing and recruitment firms measure productivity in different ways, depending on their business models. Those differences offer useful lessons for smaller agencies.
The Adecco Group measures productivity as direct contribution per selling full-time equivalent (FTE). In the second quarter of 2026, this measure increased by 6% year on year while the number of selling FTEs fell by 2%.12 Korn Ferry reports fee revenue and billed engagements for its permanent placement and executive search businesses. In the quarter ended 30 April 2026, its executive search business billed 3,794 engagements, for fee revenue of 242.0, in USD millions.8 AMN Healthcare measures its locum tenens business using days filled and revenue per day filled. Kforce adjusts revenue growth for the number of billing days in each period, making comparisons more meaningful when months or quarters contain different numbers of working days.3
None of these figures provides a direct benchmark for a staffing firm with ten recruiters. We found no public source publishing gross profit or revenue per recruiter specifically for firms of that size. However, the examples demonstrate three principles worth applying to your own reporting: measure profit rather than revenue alone, select an output measure suited to the type of staffing work, and account for differences in the calendar when comparing periods.
Recruiter workload is also changing on the employer side. SHRM reported that extra-large organisations experienced a 67% increase in median requisitions per recruiter in 2026.15 This measures in-house recruitment rather than staffing agency productivity, so it is not a direct comparison. However, it highlights the growing workload some employer recruitment teams face, which can increase their need for external staffing support.
When a recruiter's revenue appears low, look at their gross profit and placements for the month and compare those figures with the same desk's performance in the previous quarter. Only then compare them with the firm-wide average. Different desks produce different financial patterns. A direct-hire recruiter may generate relatively little revenue but substantial gross profit per placement because placement fees have high gross margins. A recruiter filling large numbers of light industrial contract roles may generate higher revenue but less gross profit per placement. Neither result is inherently better; the distinction depends on the costs, workload and overall contribution to the business.
Your monthly report should therefore show revenue per recruiter, gross profit per recruiter and placements per recruiter, with contract and direct hire separated. Together, these measures reveal whether a recruiter's output is generating meaningful profit and help you decide where additional recruiting capacity is likely to contribute most.

What does the staffing market look like in 2026?
The US staffing market is showing modest growth. That makes the KPIs in this guide especially important. In a softer market, recruiters may fill fewer orders, clients may push for lower rates, and staffing firms can struggle to protect margins.
US temporary help services employment reached 2,486.8 thousand in September 2026, seasonally adjusted and preliminary, compared with 2,471.6 thousand in September 2025, according to the Bureau of Labor Statistics.17 The American Staffing Association (ASA) reported that temporary and contract staffing employment fell by 7.5%, or 154,000 jobs, between the fourth quarter of 2025 and the first quarter of 2026, reflecting a seasonal decline.14 However, the ASA Staffing Index showed staffing jobs were 3.3% higher year on year in the week ending 13 September 2026.14
Forecasts point to limited growth rather than a strong recovery. Staffing Industry Analysts projects that the US staffing market will grow by 2.4% in 2026, reaching $183.1 billion.18 Randstad reported organic revenue growth of 1.9% in the second quarter of 2026.11 Earlier, in the second quarter of 2025, the ASA reported that staffing sales grew by 1.5% even as headcount declined, suggesting that firms were generating more sales with fewer workers.14
For staffing agency owners, this makes profitability and productivity more important than revenue growth alone. When the market is growing slowly, spread per hour, gross margin and gross profit per recruiter help reveal whether the business is becoming more profitable or simply handling more work. Firms that participate in the ASA's quarterly survey also receive a report containing gross margin and sector-level data, providing a practical way to compare their own results with broader industry figures.14
Which mistakes make these numbers lie?
Most staffing reports become misleading for a handful of predictable reasons. You do not necessarily need new software to fix them. You need consistent definitions, accurate cost data and a clear record of unusual events.
- Blending contract and direct hire.
A combined gross margin can hide what is happening in each part of the business because contract staffing and permanent placement have different cost structures. In the same quarter, Kforce reported a total gross margin of 28.5% and a Flex contract margin of 26.9%, with direct hire contributing to the higher overall figure.3 Report contract and direct-hire margins separately so a strong placement month does not conceal declining contract profitability.
- Treating a one-off as a run rate.
AMN Healthcare's consolidated gross margin benefited from reserve releases and billing true-ups, which the company disclosed. Similar adjustments can affect your own accounts, including back-billing corrections, client credits and workers' compensation adjustments. Record these separately in the month they occur. Otherwise, a temporary improvement or decline may distort forecasts and lead to poor decisions about future performance.
- Changing the fill rate definition.
A firm-wide fill rate is meaningless if one desk counts orders while another counts individual positions. Changing the calculation halfway through the year also makes historical comparisons unreliable. Write the definition at the top of the report, apply it consistently across desks and keep it unchanged unless a genuine reporting change is necessary. Document any change so you can interpret the trend correctly.
- Measuring the client's speed as the desk's.
Days to fill includes time spent waiting for the client to interview candidates and make a decision. A slow client can therefore make an efficient desk appear unproductive. Track the time from order received to first submittal separately from the time between first submittal and the worker's start date. This helps distinguish sourcing delays from slow client decisions or other problems later in the process.
- Comparing recruiters across desks on revenue.
A permanent-placement recruiter and a light-industrial contract recruiter generate revenue in different ways. Comparing their revenue alone can make one look more productive even when the other contributes more profit. Compare recruiters with their own previous results and with others running similar desks. Use gross profit alongside revenue to understand their actual contribution.
- Ignoring employment burden.
TrueBlue's reported margin bridge showed workers' compensation costs reducing gross margin by 1.2 percentage points over the year. If your report excludes employment burden, rising costs can look like a pricing problem or a drop in recruiter performance. Include payroll taxes, workers' compensation, insurance and other direct employment costs so you can identify what is actually reducing the margin.
- Quoting someone else's benchmark as a target.
The public figures in this guide describe individual companies, each with its own clients, service mix and operating model, over a particular reporting period. They help explain how staffing economics work and show the range of results in the market, but they are not automatic targets for a smaller agency. Set your targets using your own historical performance, then investigate whether changes come from pricing, costs, client behaviour or desk productivity.
How do you build the monthly desk report?
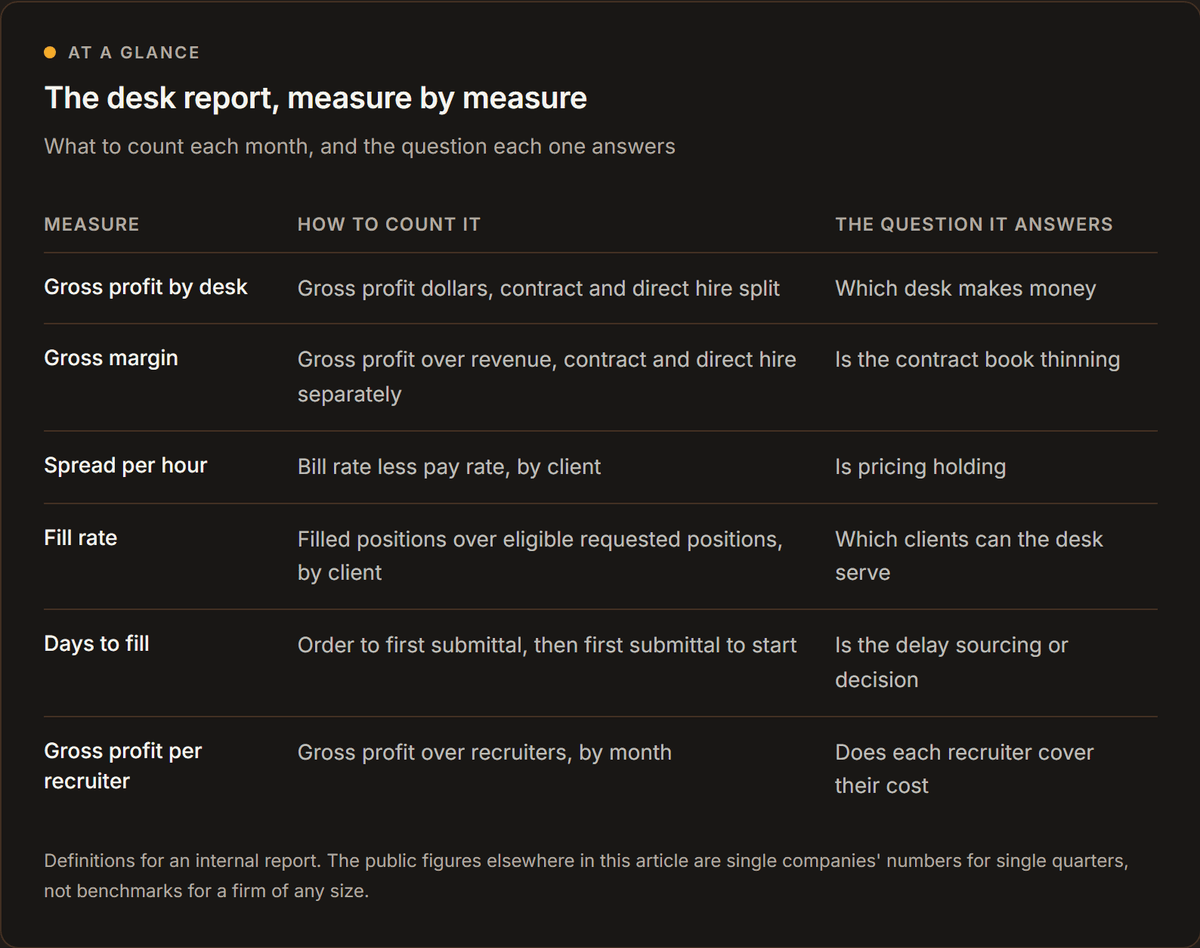
Start with the information you already collect in your applicant tracking system (ATS) or back-office system, including revenue, pay and placements by desk. Add the measures below one at a time, reviewing them monthly so you can establish reliable figures before expanding the report.
- Gross profit by desk. Record gross profit in dollars and gross margin as a percentage of revenue, with contract staffing and direct hire reported separately. Start here because revenue alone does not show which desks are profitable.
- Spread per hour by client. Calculate the bill rate minus the pay rate for each client. Include the markup percentage and any contractual markup cap so you can identify pricing pressure before it erodes profit.
- Fill rate by client. Calculate the percentage of eligible requested positions filled, using the same definition across every desk. Write the definition at the top of the report and show cancelled orders separately.
- Days to fill in two parts. Track the time from receiving an order to sending the first candidate, then from the first submittal to the worker's start date. This helps distinguish sourcing delays from delays in the client's decision-making process.
- Gross profit per recruiter. Calculate monthly gross profit per recruiter and compare each recruiter with their own performance last quarter. Where possible, make comparisons within the same type of desk.
- Submittal ratios. Track submittals per interview and interviews per placement, broken down by client and role. Calculate these ratios from your own records rather than relying on generic industry figures.
There is no public, primary source identified for reliable staffing-wide submittal-to-interview-to-placement ratios. Vendor glossaries sometimes quote ratios without publishing the underlying dataset, so this guide does not present those figures as industry benchmarks. Your own ATS records provide the most relevant starting point for understanding conversion rates across your desks.
Keep the report to one page per desk and review it with each desk lead every month. Ask the same questions each time: where did gross profit come from, which clients' spreads changed, which clients the desk struggled to fill, and whether delays arose during sourcing or during the client's decision-making process.
Once a placement starts, the guide to measuring quality of hire explains what to track to assess the hire's effectiveness. The guide to cost per hire covers the client's perspective on the cost of making a hire.
Fill rate measures the percentage of positions a staffing agency successfully fills out of all eligible positions requested by clients during a defined period.
Use these rules to keep the calculation consistent:
| Item | What to count |
|---|---|
| Positions requested | Individual worker positions requested by clients, not simply the number of job orders. One order for 10 workers counts as 10 positions. |
| Positions filled | Positions where the worker has started for contract staffing. For direct hire, count a position when the candidate accepts the offer. Report the two types separately. |
| Cancelled positions | Track cancellations separately. Exclude positions cancelled before the agency had a reasonable opportunity to fill them, according to a written rule applied consistently. |
| Reporting period | Use the same period and counting rules each month. For example, report positions opened in October and track their outcomes consistently. |
It is important to decide whether you are measuring positions requested during a particular month or positions filled during that month. These answer different questions. For the monthly desk report, counting positions requested in the month and tracking how many are eventually filled gives you a clearer view of how well the desk fulfils demand. If some positions remain open at month-end, keep them in the eligible total and mark them as still open rather than silently dropping them.
Conclusion
A staffing agency can grow revenue, fill more positions and keep recruiters busy while its margins quietly shrink. That is why the most useful staffing agency KPIs do more than measure activity. They show where gross profit comes from, which clients are worth the effort, where pricing is slipping and whether each desk is becoming more productive.
Start with the financial measures. Gross profit by desk is the revenue remaining after the direct costs of delivering staffing services have been deducted. Gross margin expresses that gross profit as a percentage of revenue, showing how much of each revenue dollar remains after direct costs. Keep contract staffing and direct hire separate because their cost structures differ. For contract assignments, spread per hour is the bill rate minus the worker's pay rate, while gross profit per hour deducts direct employment costs, such as payroll taxes and workers' compensation, from that spread. Gross profit per placement shows the contribution earned from an individual placement or assignment before overhead.
Then measure how effectively each desk turns client demand into placements. Fill rate is the percentage of eligible requested positions successfully filled, using a consistent definition and counting rule. Days to fill measures the time from receiving a job order to the worker starting, but splitting it into order-to-first-submittal and first-submittal-to-start helps identify where delays occur. Gross profit per recruiter is the gross profit generated per recruiter over a defined period, giving you a better view of productivity than revenue alone. Submittal ratios, such as submittals per interview and interviews per placement, show how candidates progress through the recruitment process.
These measures work together. A strong fill rate does not guarantee healthy margins. High revenue does not necessarily mean a recruiter is generating more profit. A wide spread can still be eroded by employment costs, while a slow time to fill may reflect a client's decision-making rather than a sourcing problem. Read the KPIs together to understand not just what changed, but why.
The real value comes when the numbers change a decision. A client whose rates no longer cover rising employment costs needs a pricing conversation. A desk with strong sourcing activity but a poor fill rate may need better client relationships or a clearer understanding of the brief. A recruiter generating substantial revenue but little gross profit may be working on the wrong mix of business. Each measure helps you identify the cause before it becomes a bigger problem.
Your monthly desk report should ultimately answer one question: is this desk turning its time, placements and client relationships into sustainable profit? If you cannot answer that confidently today, start with gross profit by desk this month. Add the remaining measures as your data becomes reliable, keep definitions consistent and compare results with your own historical performance rather than treating a large agency's quarterly figures as your target. The goal is not to collect more numbers. It is to know which decisions will make your staffing business more profitable.
Where Hivemind fits on a staffing desk
The report in this guide comes from your back office and your ATS. Gross profit, spread and pay belong to payroll and finance, and no hiring system changes those numbers by itself.
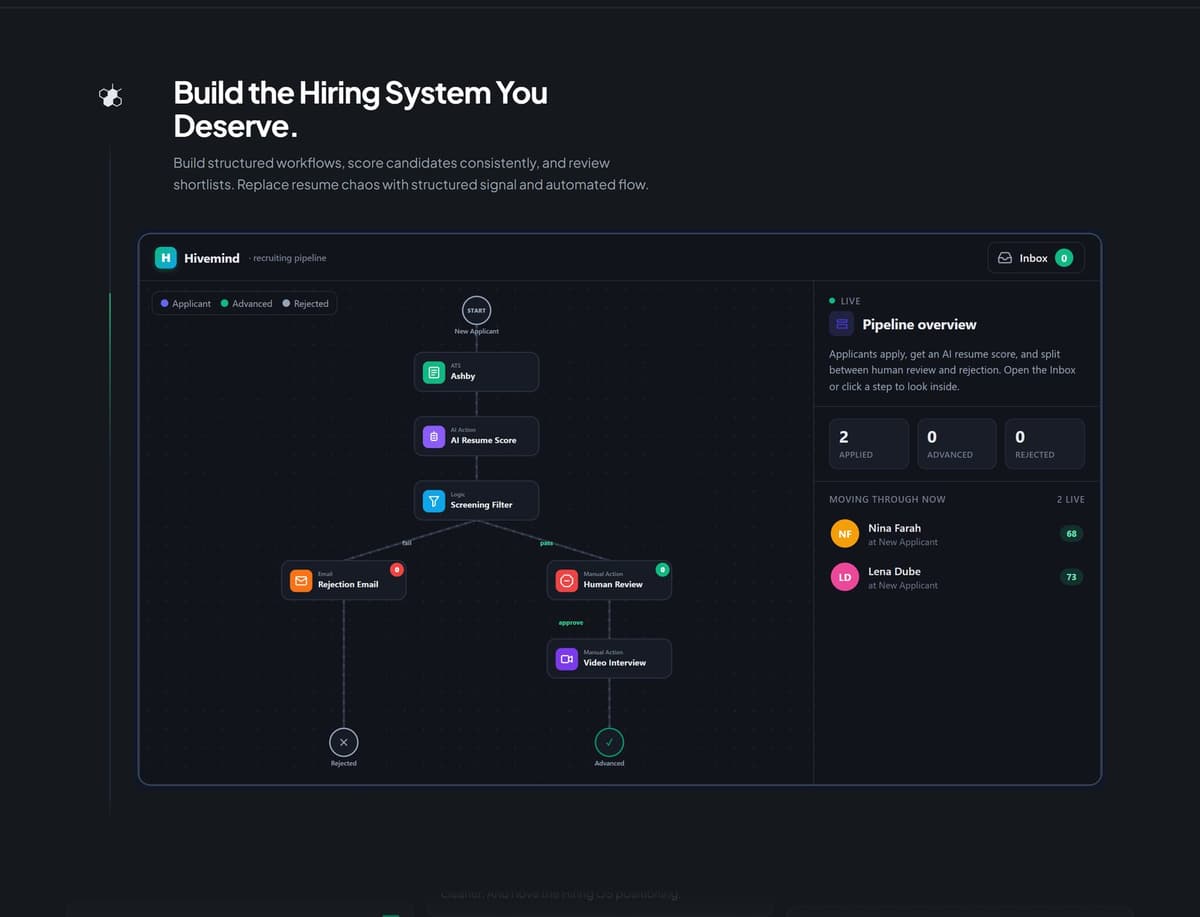
What a hiring system holds is the record of the work behind the placements: who was sourced, screened, interviewed and offered, and when. Hivemind is the hiring OS that covers sourcing, screening, interviews, offers, and the admin around them, so a desk can manage every candidate from inbound to offer in one unified workflow. A team can run Hivemind end to end, connect your existing tools, or mix and match both.
The modules that sit closest to the desk's daily work are these:
- Resumatic: AI-Powered Resume Filtering System
- Automated Skills Assessments
- Automated Emails: Smart Email Automation for Recruitment
- SMS Follow-Ups: Automated Candidate Text Messaging
Hivemind has 15 Native Modules and 275 Integrations, your hiring stack, working as one intelligent system.
Frequently asked questions
What are the most important staffing agency KPIs?
The most important staffing agency KPIs are gross profit by desk, gross margin split between contract and direct hire, spread per hour, fill rate and days to fill, followed by gross profit per recruiter. Revenue alone can hide where profit is made because much of contract staffing revenue goes towards paying temporary workers and covering their direct employment costs.
What is a good gross margin for a staffing firm?
It depends on the mix of work, client contracts and employment costs. In quarterly results from 2026, contract margins ranged from Kforce's 26.9% to Robert Half's 39.1%, while total gross margins ranged from The Adecco Group's 18.6% to GEE Group's 39.9%.12 Robert Half reported a 99.9% gross margin for permanent placement. These are individual companies' results, not universal industry benchmarks or targets for smaller agencies.
How do you calculate fill rate in staffing?
Divide the number of positions filled by the number of eligible positions requested, then multiply by 100. Define what counts as a position, the reporting period, what qualifies as filled and how cancellations are handled. Apply the same rules across desks and report results by client each month. For contract staffing, count a position as filled when the worker starts; for direct hire, use a consistent rule such as offer acceptance and report the two separately.
What is the difference between spread and markup?
Spread is the bill rate minus the worker's pay rate, expressed as a monetary amount per hour. Markup expresses that spread as a percentage of the pay rate. The Massachusetts statewide temporary help contract cited in this guide caps markup at 36.5% of the temporary worker's hourly pay rate. Gross profit per hour is the spread minus direct employment costs, such as payroll taxes and workers' compensation.
How do you measure gross profit per recruiter?
Divide the gross profit generated by a recruiter or desk by the number of recruiters responsible for producing it over the same period. Calculate it monthly and compare each recruiter with their own previous performance and with recruiters working on similar desks. The Adecco Group reports direct contribution per selling full-time equivalent (FTE), a related productivity measure. There is no established public benchmark specifically for a small staffing firm, so use your own historical results to set targets.
Why is a staffing firm's operating margin so low?
Operating margin measures the profit remaining from revenue after operating expenses are deducted. A staffing firm may retain a healthy gross margin but spend much of its gross profit on recruiter and sales salaries, management, offices, systems and other overhead. In the second quarter of 2026, Kforce reported a 5.4% operating margin alongside a 28.5% gross margin. The Adecco Group reported a 2.8% EBITA margin excluding one-off items. These figures use different measures, but both illustrate why strong gross margins do not automatically translate into high operating profits.
Sources
- Robert Half: Second quarter financial results ↩
- GEE Group: Results for the quarter to 30 June 2026 ↩
- Kforce: Second quarter 2026 results ↩
- ASGN: First quarter 2026 earnings release ↩
- TrueBlue: Second quarter 2026 earnings presentation ↩
- AMN Healthcare: Second quarter 2026 results ↩
- ManpowerGroup: Second quarter 2026 results ↩
- Korn Ferry: Quarterly report for the quarter to 30 April 2026 ↩
- Commonwealth of Massachusetts, Operational Services Division: Statewide contract for temporary help services, user guide ↩
- Tryfacta, Sourcewell contract: Staffing price list ↩
- Randstad: Second quarter 2026 results ↩
- The Adecco Group: Second quarter 2026 results ↩
- Recruiterflow: Fill rate glossary ↩
- American Staffing Association: Staffing operations benchmarking survey, Staffing employment and sales survey, Staffing employment flat in second quarter, Seasonal declines narrow in first quarter of 2026 and Staffing index edges up in September ↩
- SHRM: Recruiting benchmarking ↩
- Bullhorn: GRID report press release ↩
- US Bureau of Labor Statistics: Employment Situation, table B-1 ↩
- Staffing Industry Analysts: US staffing industry forecast, September 2026 update ↩